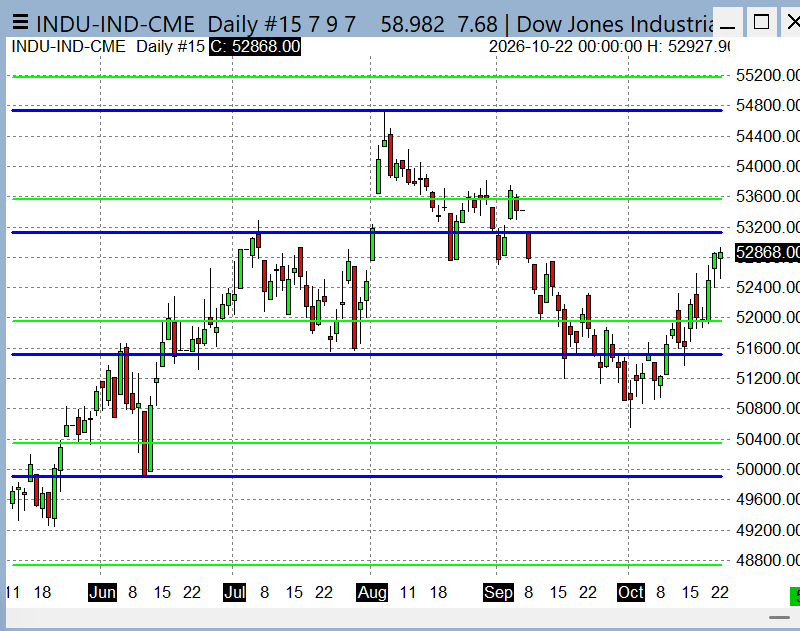
Use https://www.stockindextiming.com/h/ to access the weekly web page                               

use https://www.stockindextiming.com/h/daily.htm to access this brief daily review web page                                                                                                           https://stockindextiming.com/bullbear/ 
                                                                                               new chart page https://stockindextiming.com/chart/ 

Stock Index Timing .com
The Stock Index Timing market timing service 
is no longer published.

Brief daily review


10/22/2026  8:30 pm   SPECIAL COMMENT AND VIDEO

Click here for MARKET TOP VIDEO

SPECIAL COMMENT:  

Several emails sent this past week

Thursday, 10/22/2026

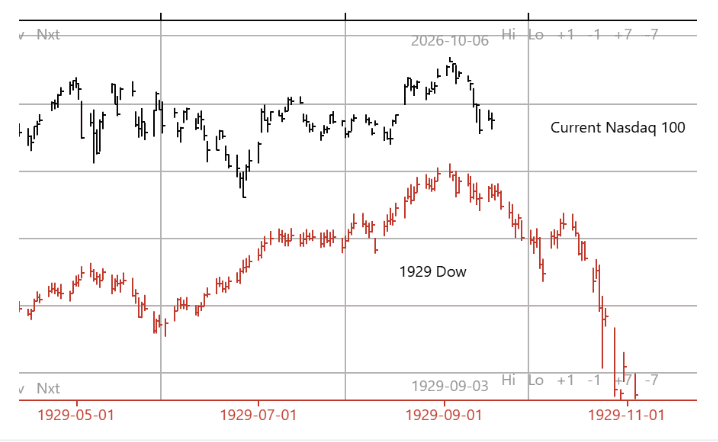
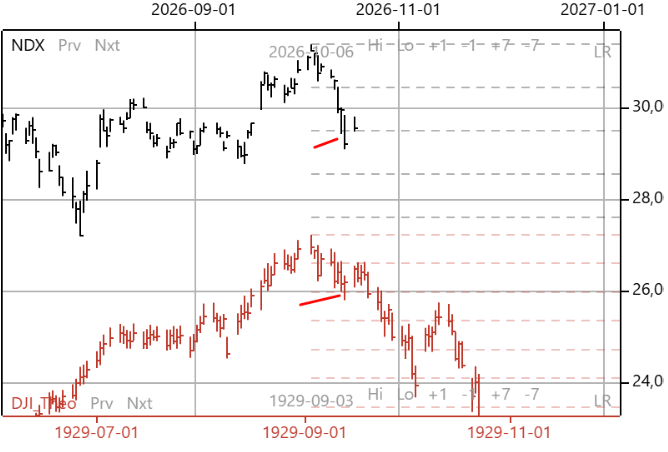
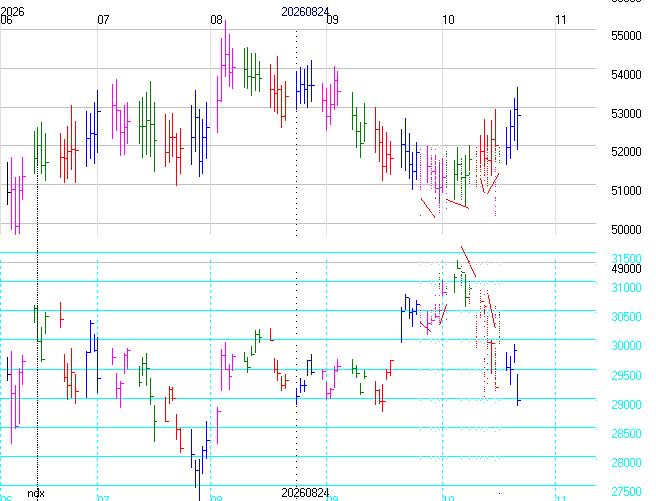
The aggressive decline in the NDX the past three weeks is actually a little stronger than 1929 so far. 

If the NDX decline continues it will drag the rest of the market down.

The comparison suggests the decline is about half way done and will continue down into the election, then bounce.
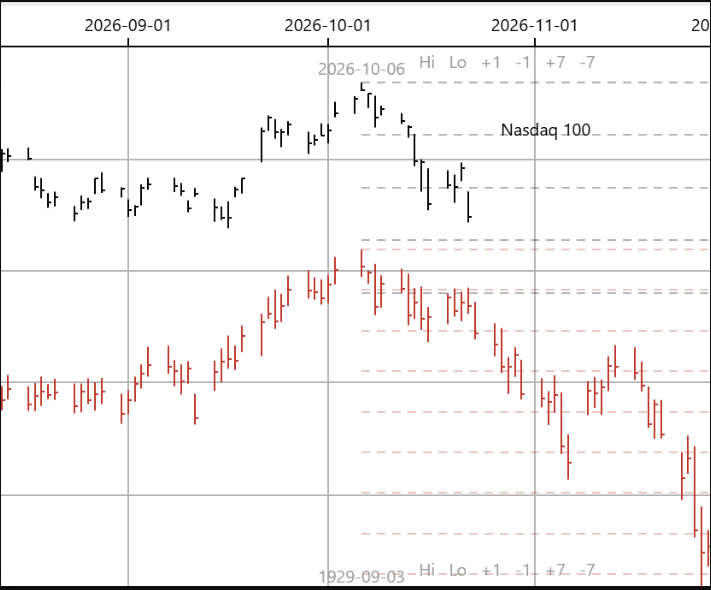
image.png

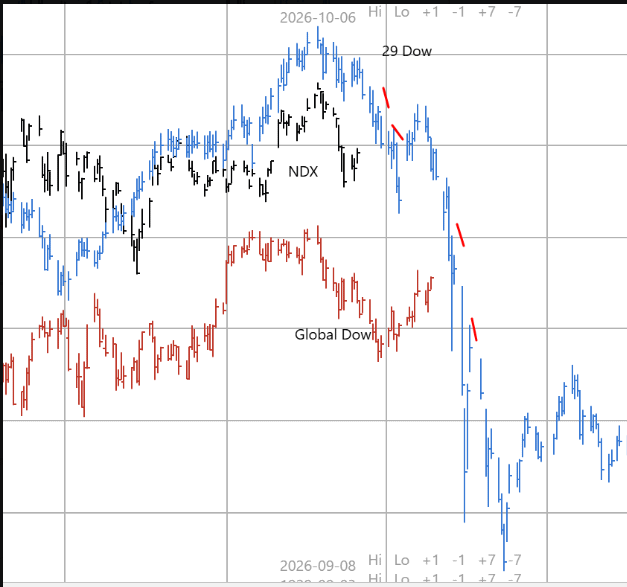
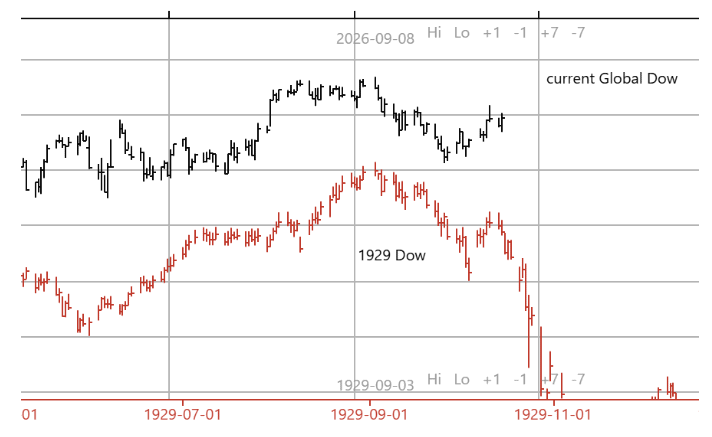
We  have also been watching the Global Dow comparison to the 1929 top the patterns are starting to separate so we don't find much guidance in the comparison. 
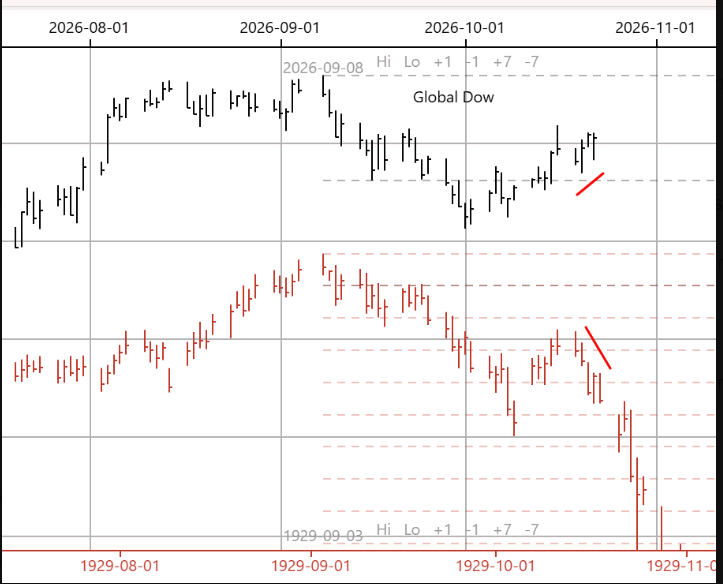
image.png

Bottom line: Stay focused on the Nasdaq 100 (NDX) index


Wednesday, 10/21/2026

Both pattern comparisons suggest a heavy decline the next two weeks

image.png


Tuesday, 10/20/2026

image.png


image.png


Monday, 10/19/2026

image.png


Bottom line: This past week we have moved our focus from "other" markets to the index in CRISIS, the Nasdaq 100. The NDX will drive the markets of the world over the coming weeks.

Call if you have any questions

George

PS Based on my video review, also pay attention to the Russell.


-------------------------------------------------------------------------

Kermit - 

 -

-------------------------------------------------------------------------

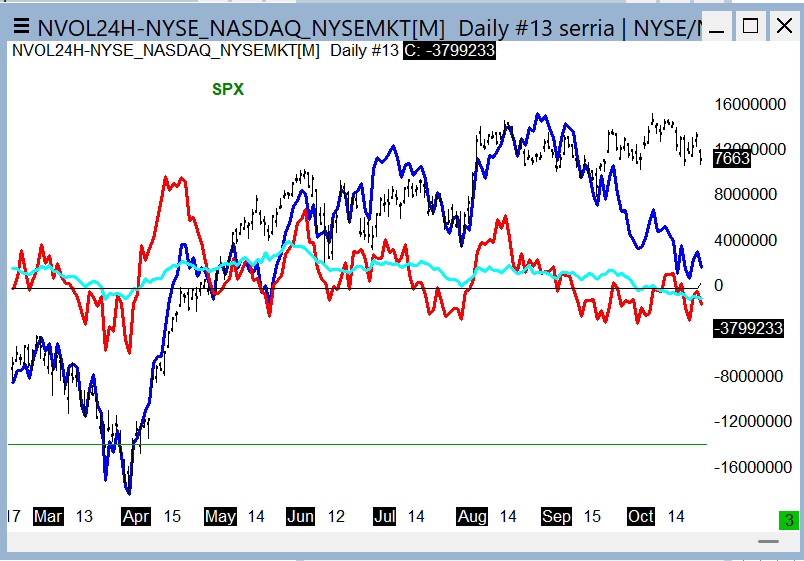
A/D volume

The following chart is the SPY with hourly On Balance Volume, and QQQ with hourly On Balance Volume.


A/D volume and oscillator -Following are the combined real time AD volume for all the combined markets

  briefvol.gif

-------------------------------------------------------------------------

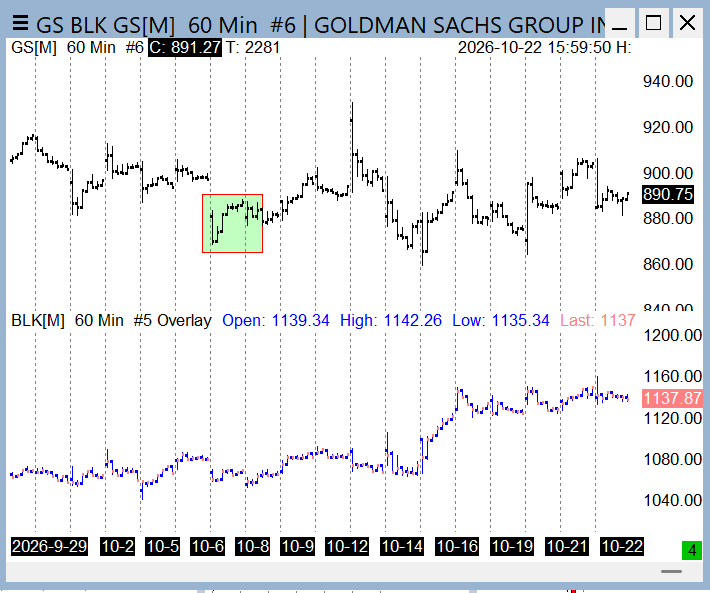
Goldman Sachs comparison to BlackRock


-------------------------------------------------------------------------


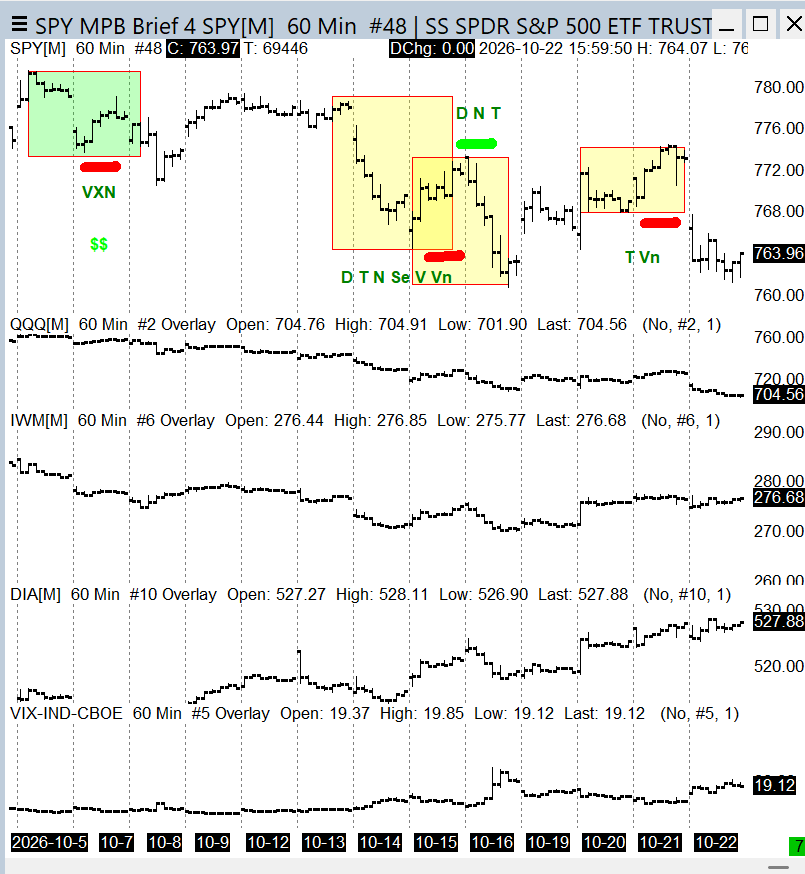
Market Price Box trade signals for the past year have a 70% probability of meeting a 1.5% (low volatility) to 2% move within 5 to 7 trading days after the signal.  Green arrow a buy trade, red arrow a sell trade. Green box a win, red box a loss, yellow box an open trade

MPB - 


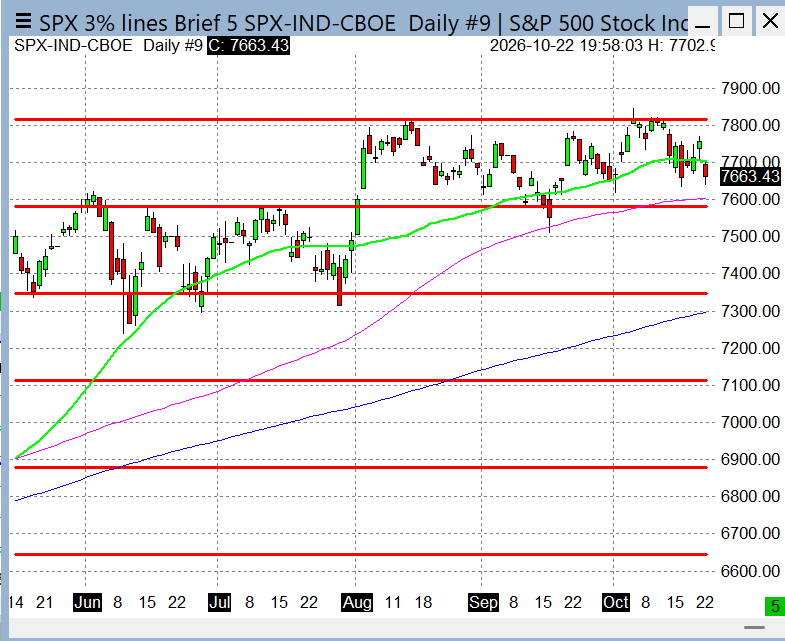
3% lines -  


------------------------------------


If anything in this report is viewed by the reader as a trade recommendation, all aspects of any trade recommendations contained in this report are subject to modification at any time. 

FUTURES TRADING INVOLVES SIGNIFICANT RISK OF LOSS AND IS NOT SUITABLE FOR EVERYONE AND THE RISK OF LOSS SHOULD BE CONSIDERED CAREFULLY BEFORE MAKING ANY TRADES. 

A STOP LOSS MAY NOT LIMIT YOUR LOSS TO THE AMOUNT INTENDED.  

YOU SHOULD BE FOREWARNED THAT SYSTEMS WHICH TRIGGER FREQUENT TRADING SIGNALS AS PART OF A DAY TRADING STRATEGY CAN RESULT IN SUBSTANTIAL COMMISSIONS AND FEES. 

PAST PERFORMANCE IS NOT NECESSARILY INDICATIVE OF FUTURE RESULTS. 

ANY STATEMENT OF FACTS HEREIN CONTAINED ARE DERIVED FROM SOURCES BELIEVED TO BE RELIABLE, BUT ARE NOT GUARANTEED AS TO ACCURACY, NOR DO THEY PURPORT TO BE COMPLETE.

ANY REFERENCE TO PERFORMANCE IS INTENDED TO BE UNDERSTOOD AS STRICTLY THEORETICAL. 

REGULATORY DISCLOSURES REGARDING HYPOTHETICAL RESULTS

HYPOTHETICAL PERFORMANCE RESULTS HAVE MANY INHERENT LIMITATIONS, SOME OF WHICH ARE DESCRIBED BELOW. NO REPRESENTATION IS BEING MADE THAT ANY ACCOUNT WILL OR IS LIKELY TO ACHIEVE PROFITS OR LOSSES SIMILAR TO THOSE SHOWN. IN FACT, THERE ARE FREQUENTLY SHARP DIFFERENCES BETWEEN HYPOTHETICAL PERFORMANCE RESULTS AND THE ACTUAL RESULTS SUBSEQUENTLY ACHIEVED BY ANY PARTICULAR TRADING PROGRAM.

ONE OF THE LIMITATIONS OF HYPOTHETICAL PERFORMANCE RESULTS IS THAT THEY ARE GENERALLY PREPARED WITH THE BENEFIT OF HINDSIGHT. IN ADDITION, HYPOTHETICAL TRADING DOES NOT INVOLVE FINANCIAL RISK, AND NO HYPOTHETICAL TRADING RECORD CAN COMPLETELY ACCOUNT FOR THE IMPACT OF FINANCIAL RISK IN ACTUAL TRADING. FOR EXAMPLE, THE ABILITY TO WITHSTAND LOSSES OR TO ADHERE TO A PARTICULAR TRADING PROGRAM IN SPITE OF TRADING LOSSES ARE MATERIAL POINTS WHICH CAN ALSO ADVERSELY AFFECT ACTUAL TRADING RESULTS. THERE ARE NUMEROUS OTHER FACTORS RELATED TO THE MARKETS IN GENERAL OR TO THE IMPLEMENTATION OF ANY SPECIFIC TRADING PROGRAM WHICH CANNOT BE FULLY ACCOUNTED FOR IN THE PREPARATION OF HYPOTHETICAL PERFORMANCE RESULTS AND ALL OF WHICH CAN ADVERSELY AFFECT ACTUAL TRADING RESULTS. PAST PERFORMANCE IS NOT NECESSARILY INDICATIVE OF FUTURE RESULTS. THE RISK OF LOSS EXISTS IN FUTURES TRADING.